
In this post I will talk about how to send Sysmon to Splunk. One of the most popular security products is Splunk, which is mainly used to identify threats and analyze events. In this part of the Sysmon 101 course, we will talk about how to send a Sysmon log to Splunk. Send Sysmon Log to Splunk via UF One way to send data to Splunk from endpoints such as servers and clients is UF or Universal Forwarder. Through UF we can send all the events and logs in an endpoint to the Splunk server, I think you are familiar with Splunk and UF setup, so here’s how to send a Sysmon Log to Splunk.
What Is Splunk?
Splunk is a software platform to search, analyze and visualize the machine-generated data gathered from the websites, applications, sensors, devices etc. which make up your IT infrastructure and business.
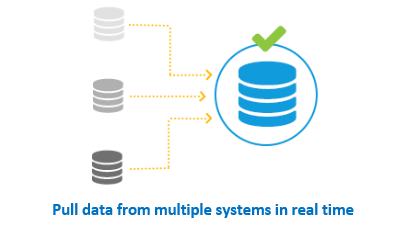
If you have a machine which is generating data continuously and you want to analyze the machine state in real time, then how will you do it? Can you do it with the help of Splunk? Yes! You can. The image below will help you relate to how Splunk collects data. (from)
Send Sysmon Logs To Splunk
After you installed Sysmon in the previous sections, now to send sysmon events to Splunk, we first configure UF or Universal Forwarder … To do this, we open the input.local file, which is usually in the path The following is
C:\Program Files\SplunkUniversalForwarder\etc\apps\SplunkUniversalForwarder\local\inputs.confAfter opening the input.local file, add the following value to it
[WinEventLog://Microsoft-Windows-Sysmon/Operational]
checkpointInterval = 5
current_only = 0
disabled = 0
start_from = oldest- Note: If your environment can not work with UF you can use Windows Event Forwarder to send Sysmon Log.
The second method used to transfer Sysmon Log to Splunk is the Local method. Through this method, we integrate Sysmon with Splunk, in which case the sysmon must be directly on the system on which Splunk is installed. Note: This method is not applicable for organizational environments and is used only for test environments.
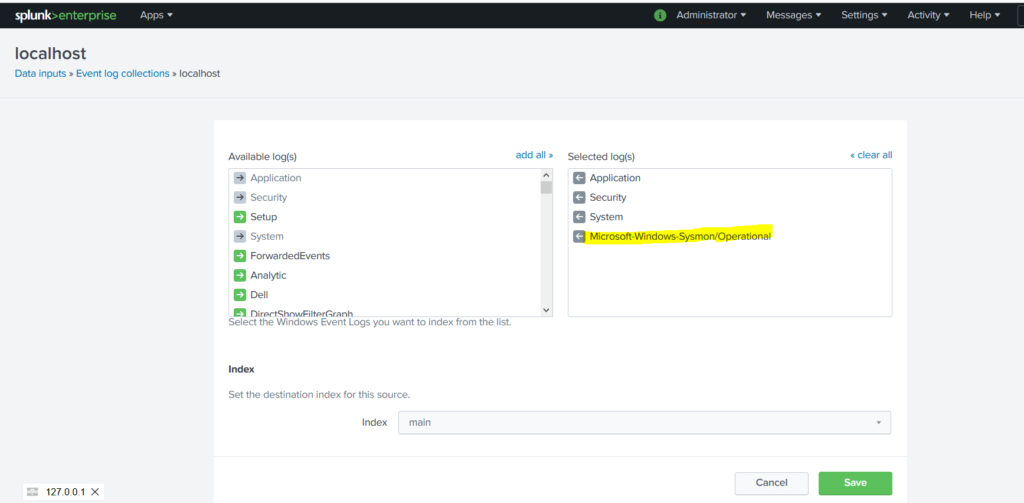
To implement this we go to Splunk and go to the following path in Splunk
Settings -> Data Inputs -> Local Log Event Collections and follow the image below
It now receiving sysmon log from Endpoint(s) in Splunk. To confirm this, we can search for “Sysmon” in Splunk:
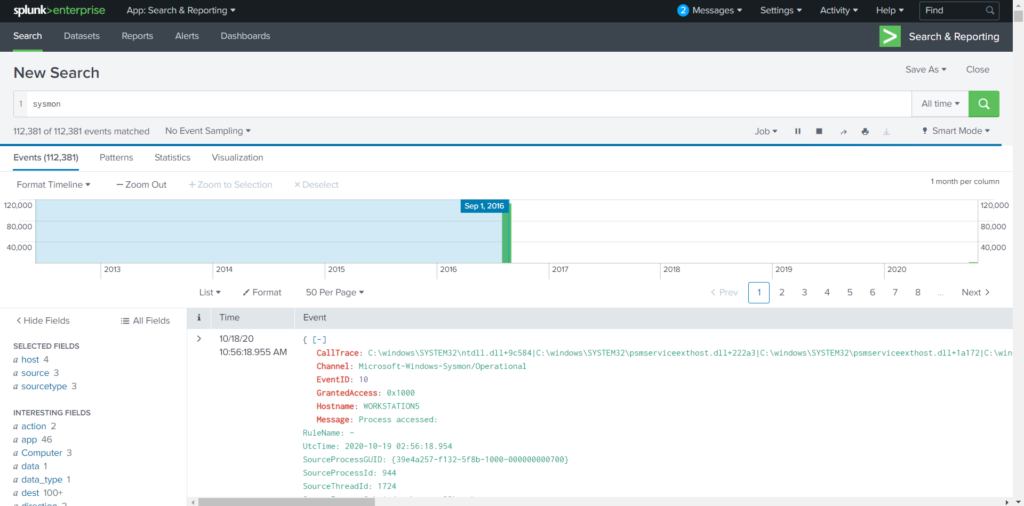
- Note: We can also see sysmon data by specifying the Sourcetype
